5 of 55 Displaying data examples
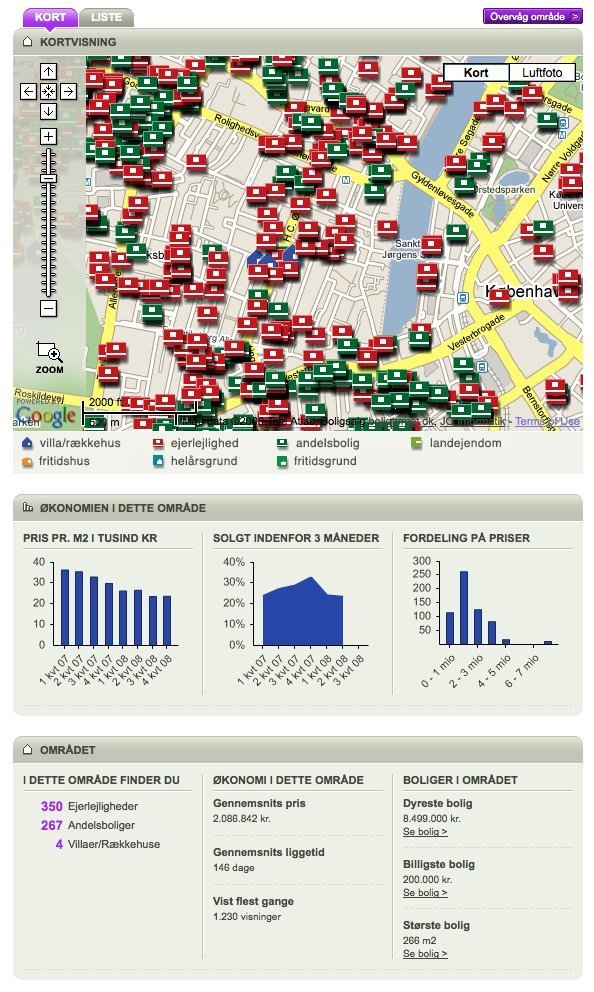
At the Danish real-estate website boligtorvet.dk, you can select a certain area on a google maps mashup, where all properties for sale or rent are plotted. Below the map, the historic development in prices for properties shown on the map is shown. If you zoom out or in any way change the map, the graphs are instantly updated corresponding to the properties seen on the map.
Displaying data at boligtorvet.dk
- boligtorvet.dk (source)
- Browsing Displaying data collection by Anders Toxboe
- Categorized under graph mashup data
- Uploaded by Anders Toxboe
- Added on 2008-12-31