Join the early bird Black Friday list

Black Friday is just around the corner, and we’re excited to offer early access to our best deals of the year at shop.learningloop.io. If you’re looking to elevate your brainstorming sessions and streamline your team’s workflow, our printed card decks are here to help.

Want to get in before everyone else?
Join our Black Friday Early Bird list to be the first to know when discounts go live! We’re launching the sale early this year, so you can grab your deck and start putting it to use before 2025 even begins.

Join the list

Last update: February 18th, 2016

The market for real time web analytics, that lets you understand your users by recording their actions, playing them back to you and distilling them into revealing eye tracking heatmaps, conversion funnel analyses, and confetti charts, is growing.

Much has happened since our last review, 4 years ago. The amount of notable competitors have more than tripled. As have the level of analysis and value each provide.

Real-time user recording tools take over from where traditional web analytics tools like Google Analytics stop. They give an insight into why users interact, halt, or drop out – without time consuming user testing. They allow you to connect the dots outlined by traditional web analytics, so you can turn them into real actions.

The real time analytics tools will help you visualize visitor behaviour by

  • Recording and playing back user behaviour and interaction
  • Providing eyetracking, click, scroll, and tap heat maps
  • Asking your users questions through surveys and polls
  • Chatting with live visitors as you watch their actions in real time
  • Analyzing form and conversion funnels

Choosing the contestants

After comprehensive research, these services are the best in class and deserve attention in this review: Crazy Egg, ClickTale, Mouseflow, Inspectlet, Lucky Orange, HotJar, and Mousestats, and Navilytics.

A few didn’t make the cut

There is a myriad of services trying to solve the same problem. A few did not make the cut into this review, simply because they were inferior services at the time: PT Engine, Clicky, and SessionCam.

In the other end of the spectrum is IBM’s Tealeaf and ClickTale. Both are available through account sale only and cater to the upper end of the market and dedicate human specialists to help you analyse their data. For the sake of comparison with our last review, ClickTale have been included in this review against their own will.

According to datanyze.com, the most popular services today are the following.

Service Websites using it
Crazy Egg 81,254
ClickTale 24,332
Mouseflow 9,022
Inspectlet 7,938
Lucky Orange 4,523
IBM Tealeaf 468
HotJar N/A
Mousestats N/A
SeeVolution N/A
Navilytics N/A

The test

All services have been tested in real-life using UI-Patterns.com as a test case. Each service was tested in isolation over a minimum of 2 weeks with a tracking script being live on UI-Patterns.com. All features of each service was evaluated and the pricing plan that gave the most features was always selected.

Report-based vs Always-on

There seems to be two approaches to building a heat map and user-recording service: Always-on and report-based.

  • Always on recommended
    Allows you to dwell into freshly collected data on all your pages, all the time. If you are half-way serious about your web analytics, you don’t want to wait for hours (or even longer if it’s for a non-popular URL) to get your results like you need to with the report-based approach. Always-on services cost more and recording limits tend to run out way sooner than you expect. Be sure to set up quota-staggering before you begin.
  • Report based
    Set up a report for one URL and wait until enough data has been collected to generate a report. Report-based services are the cheapest, but aren’t nearly as useful and effective as the always-on services. You tend to want your answers right away instead of having to wait for a few hours before enough data has been gathered. Report based services do not allow this.

Answering one question with data often raises several new. If you are akin to this dilemma, the report based services will frustrate you. Here you need to know what you’re looking for and have to wait for the results.

Always-on services

  • ClickTale
  • Mouseflow
  • InspectLet
  • SeeVolution
  • Navilytics

Report-based services

  • Crazy Egg
  • Lucky Orange
  • HotJar
  • MouseStats

Feature overview

All services provide basic heat maps: Mouse move, click, and scroll and most also playing back recorded user behavior. A few go to greater length.

User recording and playback Heatmaps Funnel & form analysis Advanced analytics Surveys, Polls Real time chat
Crazy Egg x
MouseStats x x
Lucky Orange x x x x x
SeeVolution x
InspectLet x x x
Navilytics x x x
HotJar x x x x
Mouseflow x x
ClickTale x x x x

Review of each service

Heatmap and user-recording services come in two forms; report-based and always-on. To be just, it does not make sense to mix the two categories. This is why there will be two winners of this test: one for each of the two categories.

Test parameters

Judged on a scale from 1 (worst) to 5 (best) on the following parameters:

  • Features
  • Usefulness
  • User experience
  • Maturity
  • Price

Always on services

Delivering the always-on approach requires serious performance trimming and entails massive storage costs for the provider. The main downfall is more expensive services per recording (as you will automatically record everything) compared to the report based alternatives. Ordered by popularity, the Always-on services are ClickTale, Mouseflow, Inspectlet, Navilytics, and SeeVolution.

ClickTale

Over the last 4 years, ClickTale has shifted to being for everybody to being only for enterprise customers. They see themselve compete more with IBM’s Tealeaf than with the rest of the bunch. It was impossible to get access to a trial version as ClickTale did not want to be compared and put in the same boat as everybody else. I did however manage to get a demo of ClickTale over a Skype session.
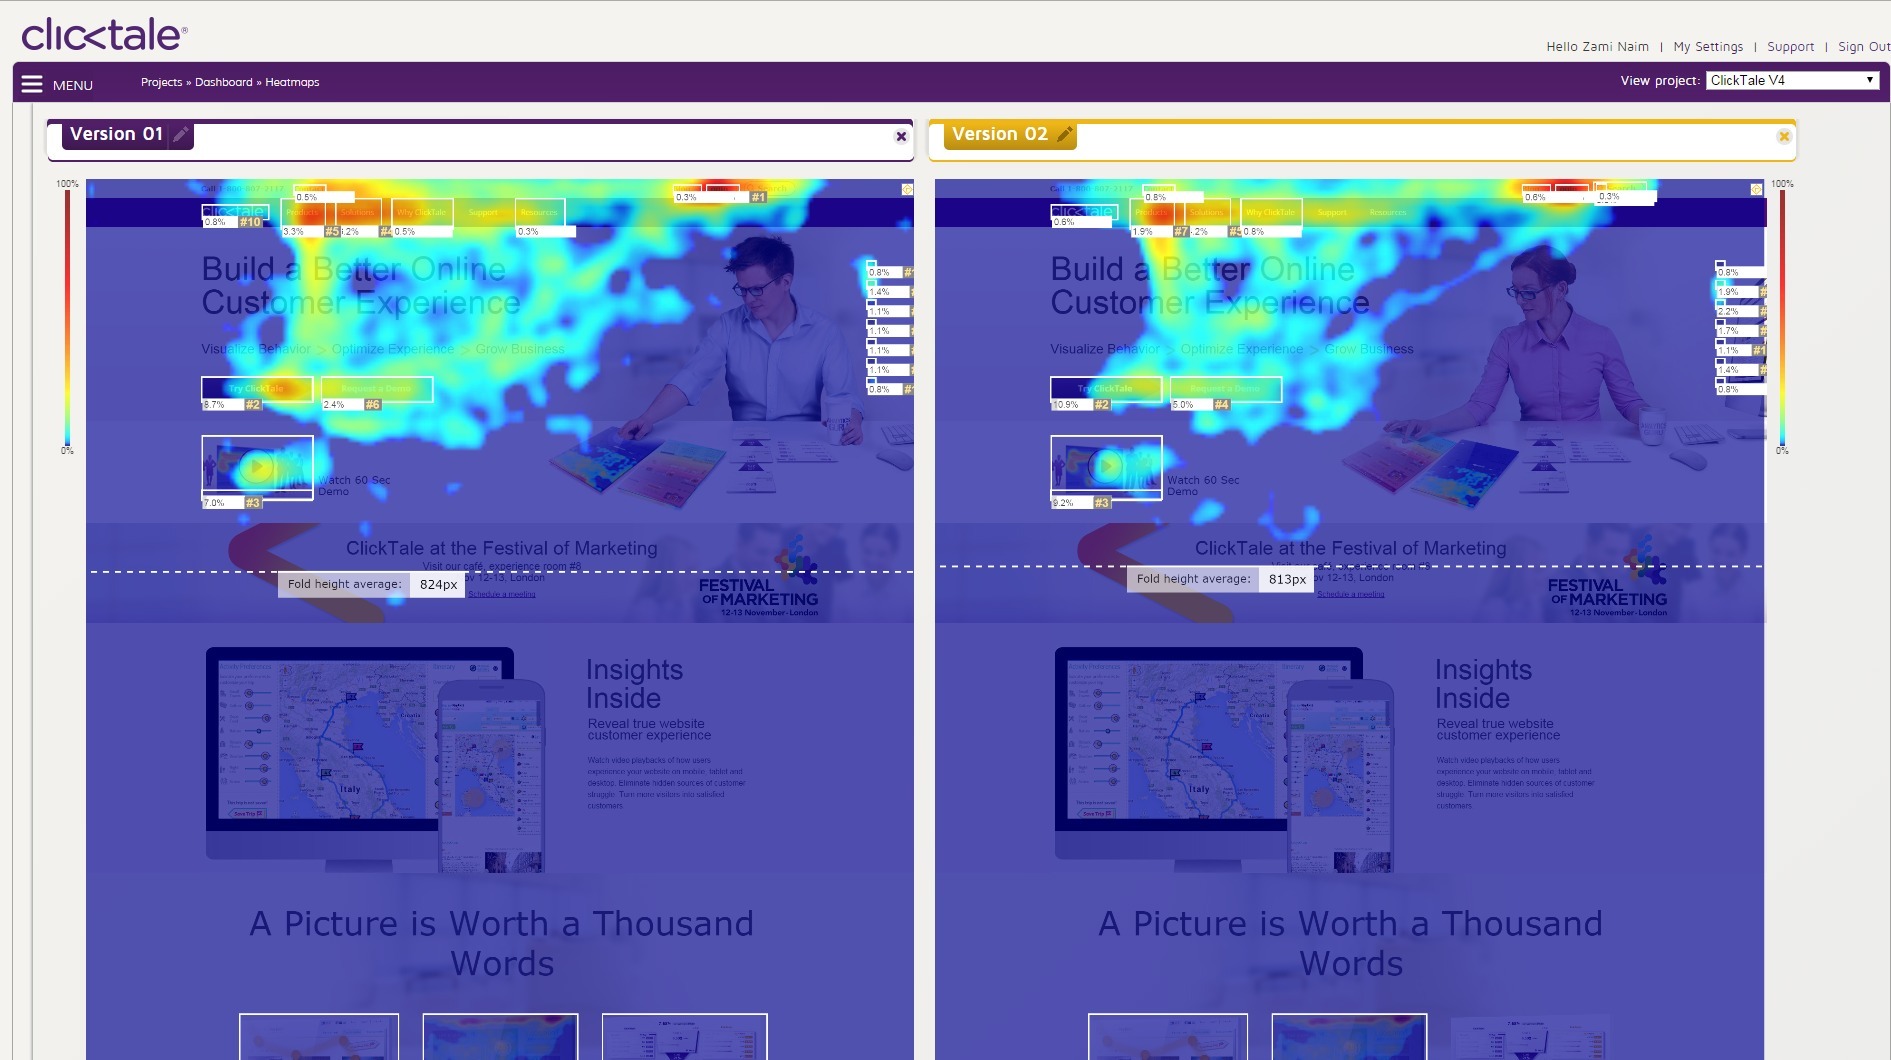
With ClickTale, you can examine how users interacted with your A/B tests of Optimizely or Visual Website Optimizer (VWO).

With ClickTale, you can examine how users interacted with your A/B tests of Optimizely or Visual Website Optimizer (VWO).

ClickTale is the most mature service of the bunch. They have taken several steps to set themselves apart:

  • A separate side-service only for tracking mobile users
  • Integration with partners that lets you dwell into your Optimizely A/B tests or Omniture segments (and cookies)
  • Reuse of reports and segments of Google Analytics, Omniture, etc.
  • Bounce reports
    • Hard bounces (4 seconds)
    • Soft bounces (the wrong people)

ClickTale argues that “it’s easy to just look at heatmaps and draw conclusions – everybody can do that – the hard thing is analysing the data. This is where ClickTale excells.” When you start a cooperation with ClickTale, trained personnel will assist you in understanding your data.

ClickTale is a full-fledged analytics suite that its competitors aren’t even close to matching. Its palette of features and possibilities is so broad, that you need a dedicated professional to get the most out of what ClickTale provides. If you are just starting out, I wouldn’t even dream of starting with ClickTale.

It wasn’t possible to get an average price out of the marketing staff that agreed to talk to me. I assume ClickTale is not cheap.

Features Usefulness User experience Maturity Price Overall
ClickTale 5 5 4 5 1 4.0
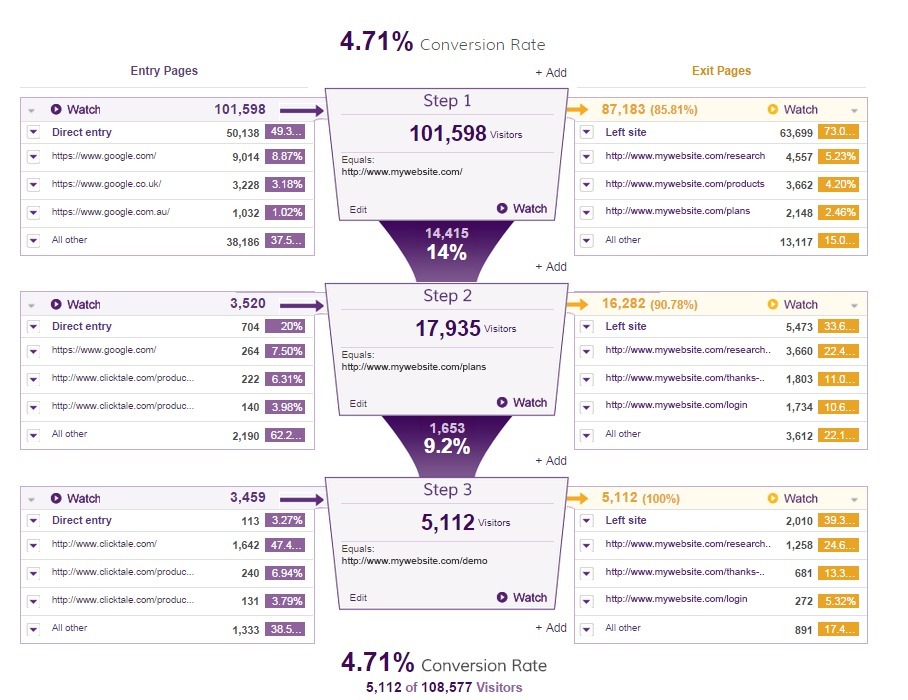
Improve your flow, forms, and checkouts with ClickTale's conversion funnel analysis.

Improve your flow, forms, and checkouts with ClickTale's conversion funnel analysis.

Mouseflow

Mouseflow is one of the older players and has a user base to prove it. It is rock solid and works perfectly. Compared to the rest of the bunch, it seems a bit old in its user interface and some the user experience challenges it faces have been solved more smoothly by its younger competitors. Mouseflow has recently relaunched its site with a new, intuitive, smooth, and up-to-date interface.

The lack of funnel analysis, form analytics, and direct user feedback options puts Mouseflow in the back of the race in terms of number of features. Mouseflow recently launched extensive form analysis, that unlike it’s competitors, support live filtering of all forms, back in time, with shortcuts to user recordings that show concrete users dropping out.

However, the service Mouseflow provide is hassle-free, smooth, and always on. It is not as full-fledged as ClickTale, but at the same time not as bloated. It is easier to use than its closest competitors.

Mouseflow is a data company. They are the only service that lets you live filter heat maps and recordings – that is from hundred of thousands of recordings. Where HotJar uses sampling of data to make heat maps seem more alive, Mouseflow has a no-cheating approach that handles impressive amounts of data in real time.

Live filtering of heat maps makes it possible to investigate specific user segments: is the behavior the same when people come from google vs facebook? How is the behavior different between people who bounce and people who are engaged (who view more than one page, who interacts with forms, or who complete a sign up).

Features Usefulness User experience Maturity Price Overall
Mouseflow 4 5 4 4 3 4.0

Inspectlet

Inspectlet is simple to use. It gets out of the way in order to let the user do what he or she needs. The simple funnel analysis and filtering options is a breeze to use and covered my basic needs.

Inspectlet provides simple conversion funnel analysis as seen in Google Analytics.

Inspectlet provides simple conversion funnel analysis as seen in Google Analytics.

When watching recordings I often felt that the tempo was a bit off. I would jump between screens in a speed that didn’t match the time on each page, and clicks on buttons seemed to be off from where the buttons actually were.

I often use screenshots of a page with the heat map on top for presentations in my work. It’s a repeating task when you are a regular user. With Inspectlet, taking screenshots was a cumbersome process. Even my Chrome screenshot extension gave up.

Inspectlet does what it does good with a few minor glitches. It doesn’t have the newer features that have started appearing lately such as watching live recordings, live chatting, surveys, and polls. Inspectlet is the second cheapest option in the test, which puts it back in the race.

Features Usefulness User experience Maturity Price Overall
Inspectlet 3 4 4 3 4 3.6

Navilytics

Setting up Navilytics was easy and painless. Although the user interface isn’t as pretty and polished as its competitors, Navilytics does its job well. Most analytics features are there, but aren’t explained and introduced well. This gets annoying.

As one of the only products in the test, Navilytics features the same confetti segmentation as CrazyEgg does. That’s a major plus. So is the ability to share recordings with your co-workers via a secret URL.

Features Usefulness User experience Maturity Price Overall
Navilytics 3 3 2 2 2 2.4

SeeVolution

SeeVolution is a minimal but sleek service that takes a different approach than the rest. As opposed to a backend-style analytics interface of its competitors, all analytics is done directly on your own site.

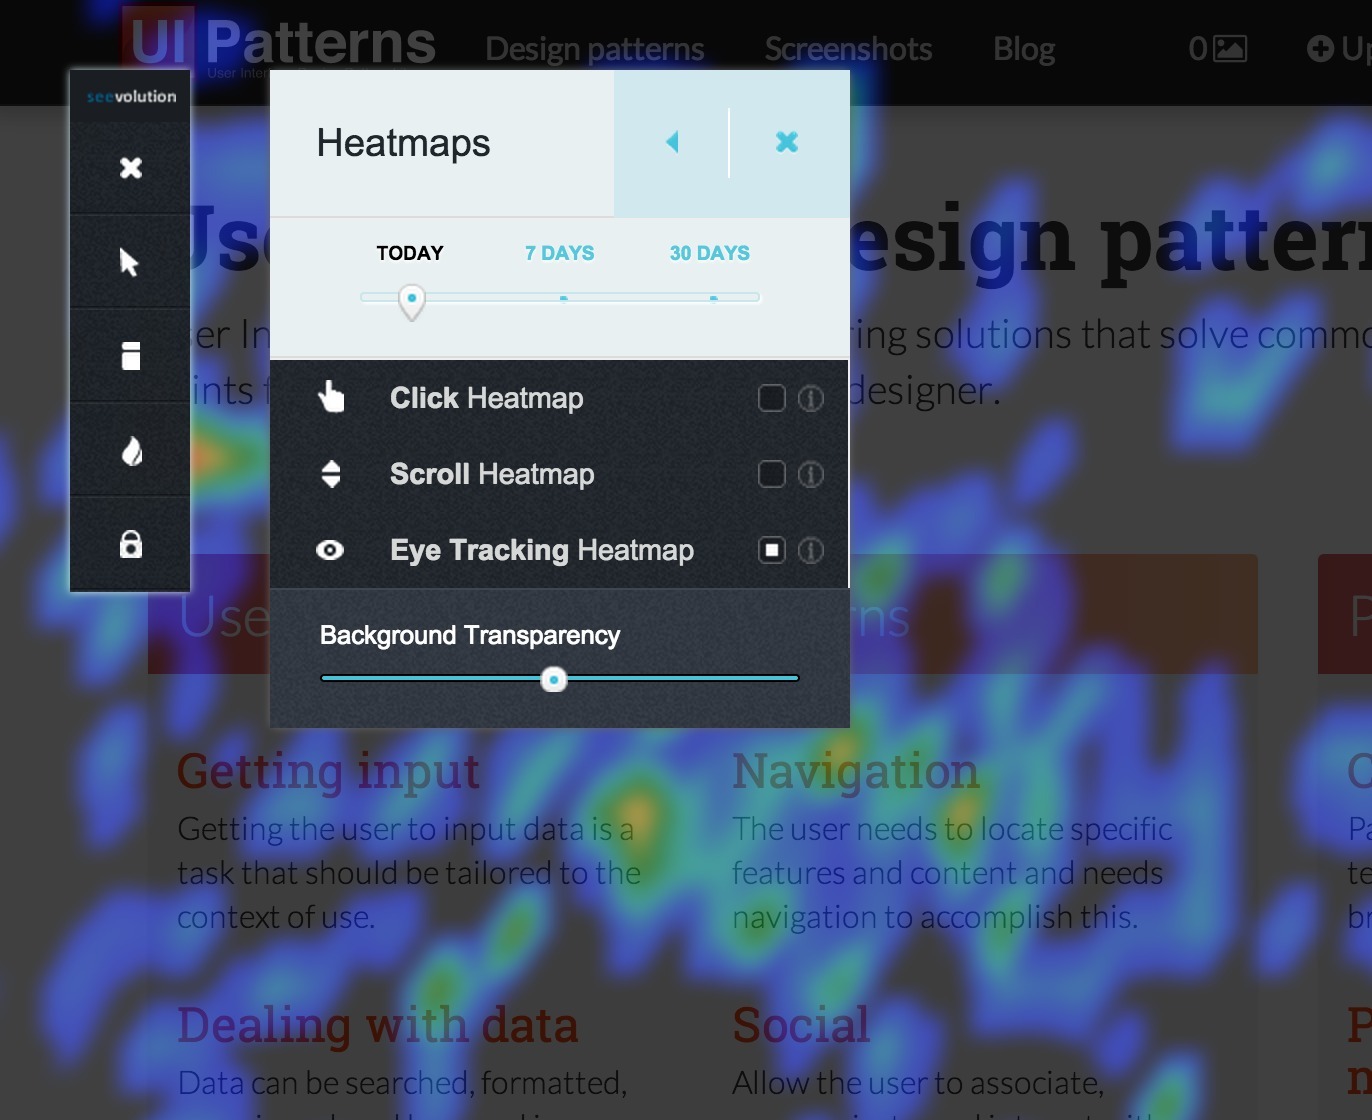
If you’re logged in to the SeeVolution service, a small marker will appear in the bottom left of your page. When you click it, you can explore heat maps (and layer them on top of each other) as well as see real time analytics. If you’re on a mobile device, the heat map data will filter acoordingly. By far the sleekest interface.

The SeeVolution interface is layered on top of your website - while you're on your website.

The SeeVolution interface is layered on top of your website - while you're on your website.

On the downside, the massive client side javascript made my CPU fan go crazy – it could use some tweaking. The SeeVolution only provide heat maps and real time analytics; no visitor replay, campaign tracking, or surveys.

However, the interface and idea is so sleek, that the service is worth mentioning.

Features Usefulness User experience Maturity Price Overall
SeeVolution 3 3 3 2 3 2.8

Report based services

Report-based heatmap services are cheaper than the always-on kind. Furthermore, you rarely run out of recordings and heatmaps can be saved for later comparison. Ordered by popularity, the report based services are Crazy Egg, Lucky Orange, HotJar, and MouseStats.

Crazy Egg

CrazyEgg is the most widespread service of the bunch due to how long they’ve been in the game. The age of the service has matured it into being rock solid and stable. Its maturity unfortunately also reflects on the user experience, feature palette, and usefulness.

When generating heat maps, you have to set up separate reports for mobile and tablet users. The process is cumbersome. Why not just generate for all devices at once?

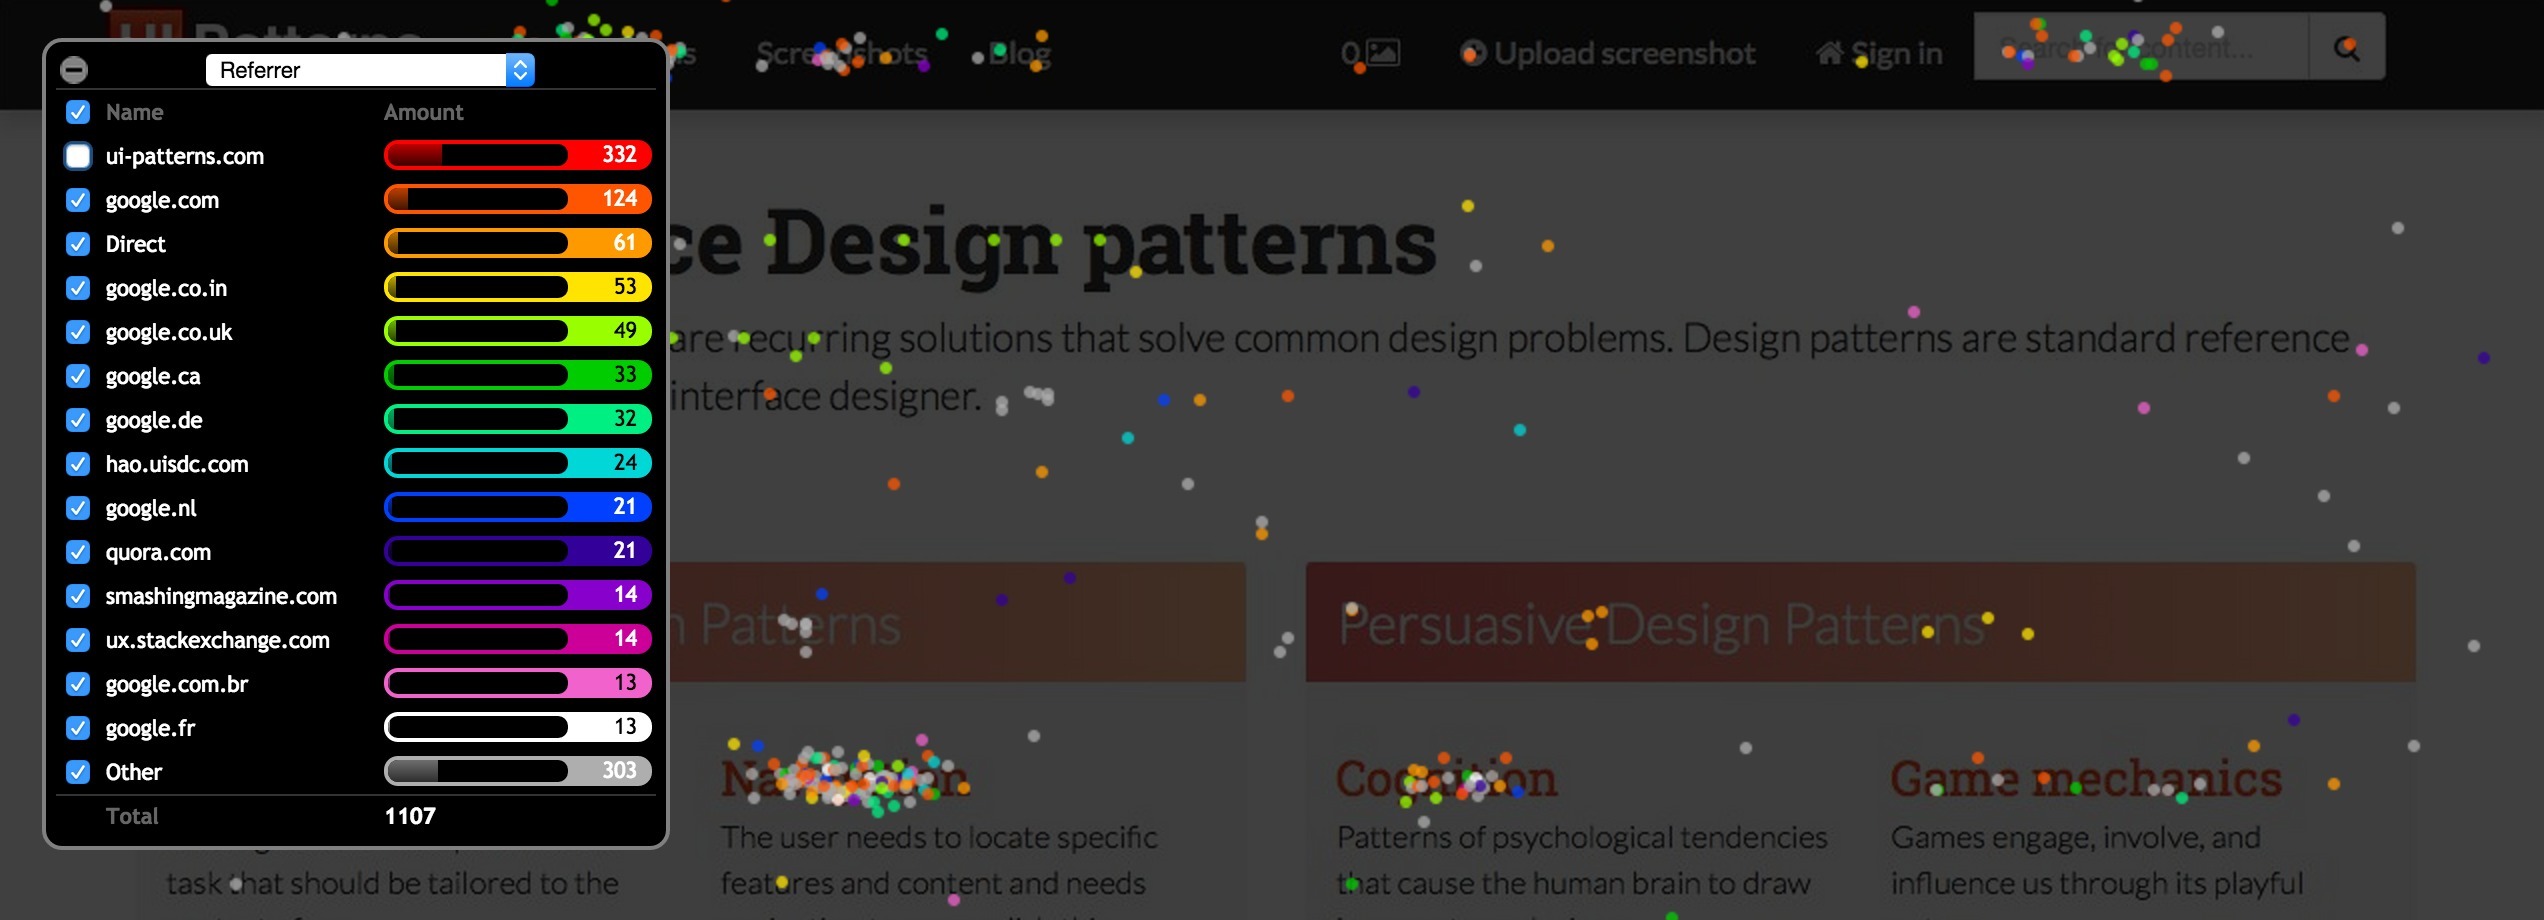
CrazyEgg creates heatmaps for you. That’s it. However, the heatmaps they do deliver are top notch. I am especially fond of the confetti map, which lets you visually explore and filter clicks through a large variety of metrics including search terms and google analytics campaign codes.

The confetti mode from Crazy Egg is a clever way to explore visitor behavior

The confetti mode from Crazy Egg is a clever way to explore visitor behavior

CrazyEgg does only few things, but do them well. There are several downfalls though: sparse feature palette, no tracking of logged-in pages, and weird differentiation between desktop, tablet, and mobile. I would love to see a CrazyEgg 2.0.

Features Usefulness User experience Maturity Price Overall
Crazy Egg 2 2 2 4 3 2.6

Lucky Orange

Signing up for Lucky Orange is a blast. It’s a smooth proces that even makes you happy.

As soon as you’ve installed the javascript code on your website, you start seeing the dashboard change. A doorbell rings every time a new visitor arrives (you can turn it off). It’s like being in a computer game that you want to keep open in the background as you proceed with other work. If you get stuck, they even have a live chat that will guide on your way to get the most out of the service. It’s a joy. Lucky Orange is full of small details.

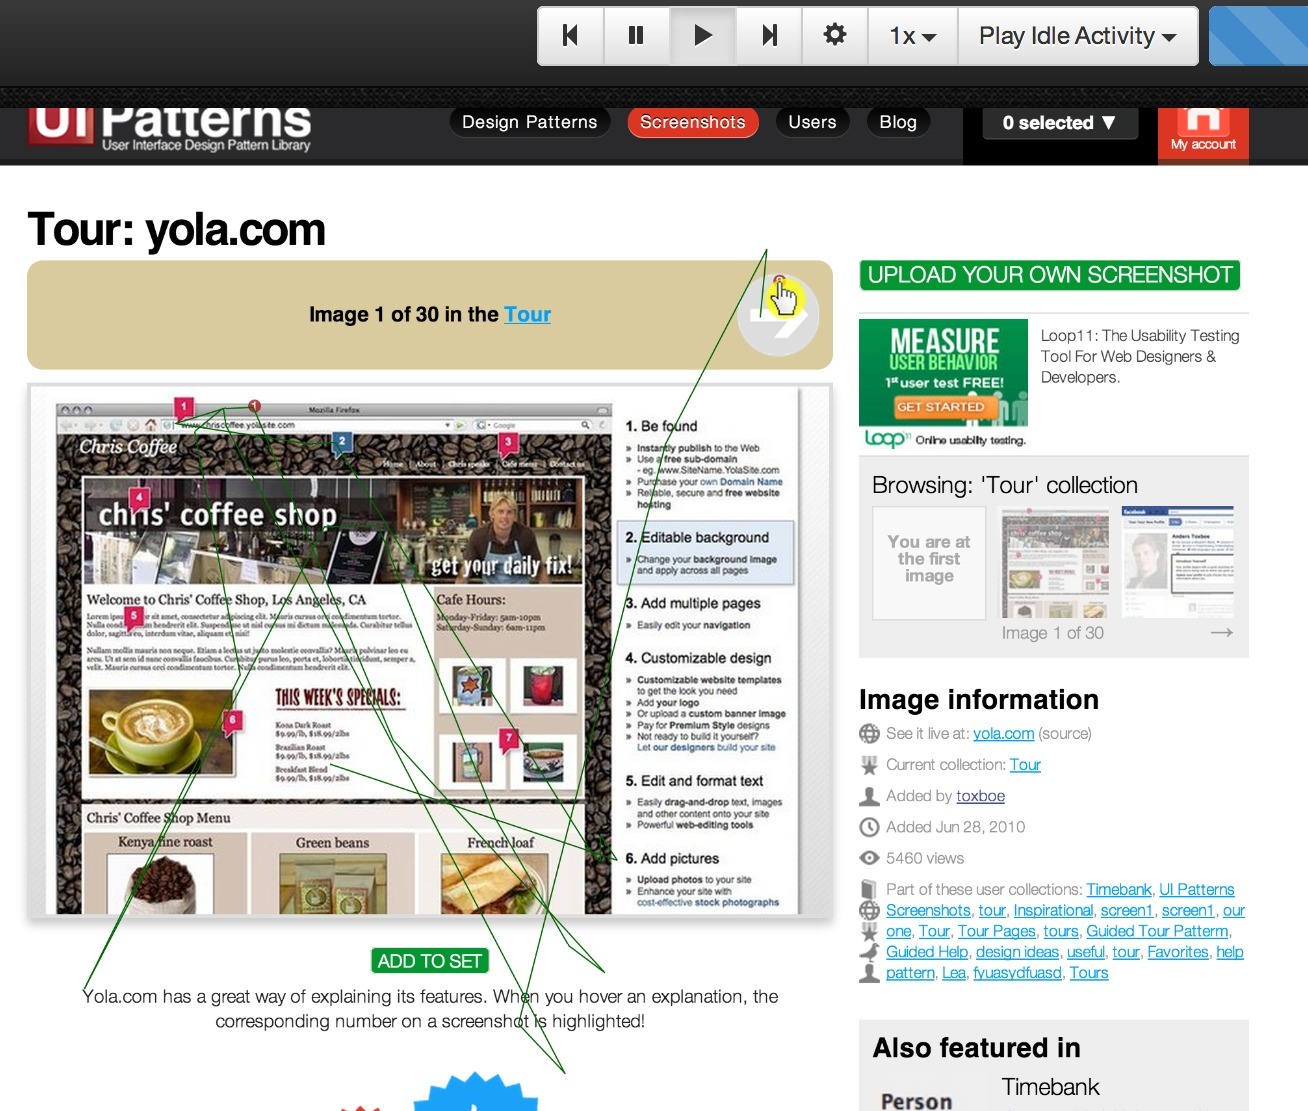
When watching recordings, the past mouse movements is shown (and summarized) with a green path that leaves a good impression of how driven or frantic your users are.

When watching recordings, the past mouse movements is shown (and summarized) with a green path that leaves a good impression of how driven or frantic your users are.

Lucky Orange allows watching what your visitors are doing live. On top of that, you can even start a chat with live visitors: either to aid them toward their goal or enquire what went wrong.

Setting up customised pop-up surveys and polls, you can ask your visitors questions. The focus for Lucky Orange seems to be on live interaction rather than being a silent listener.

The downside of Lucky Orange is that it’s report based. You have to know what you’re looking for. To view heatmaps or analyze forms, you have to set up reports. They take a few minutes to render, but once created, they are in the prettier and more useful end of the scale.

Another downside is that, it seems like Lucky Orange haven’t quite broken the mobile vs desktop problem. It seems as if the same heat map graphics are used for both views.

Features Usefulness User experience Maturity Price Overall
Lucky Orange 3 3 4 4 4 3.6

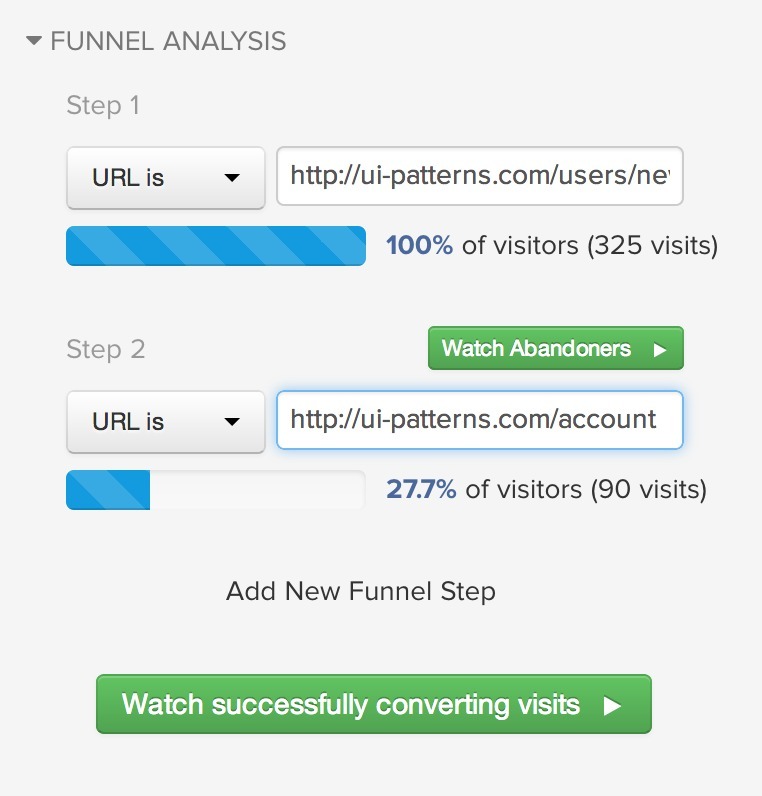
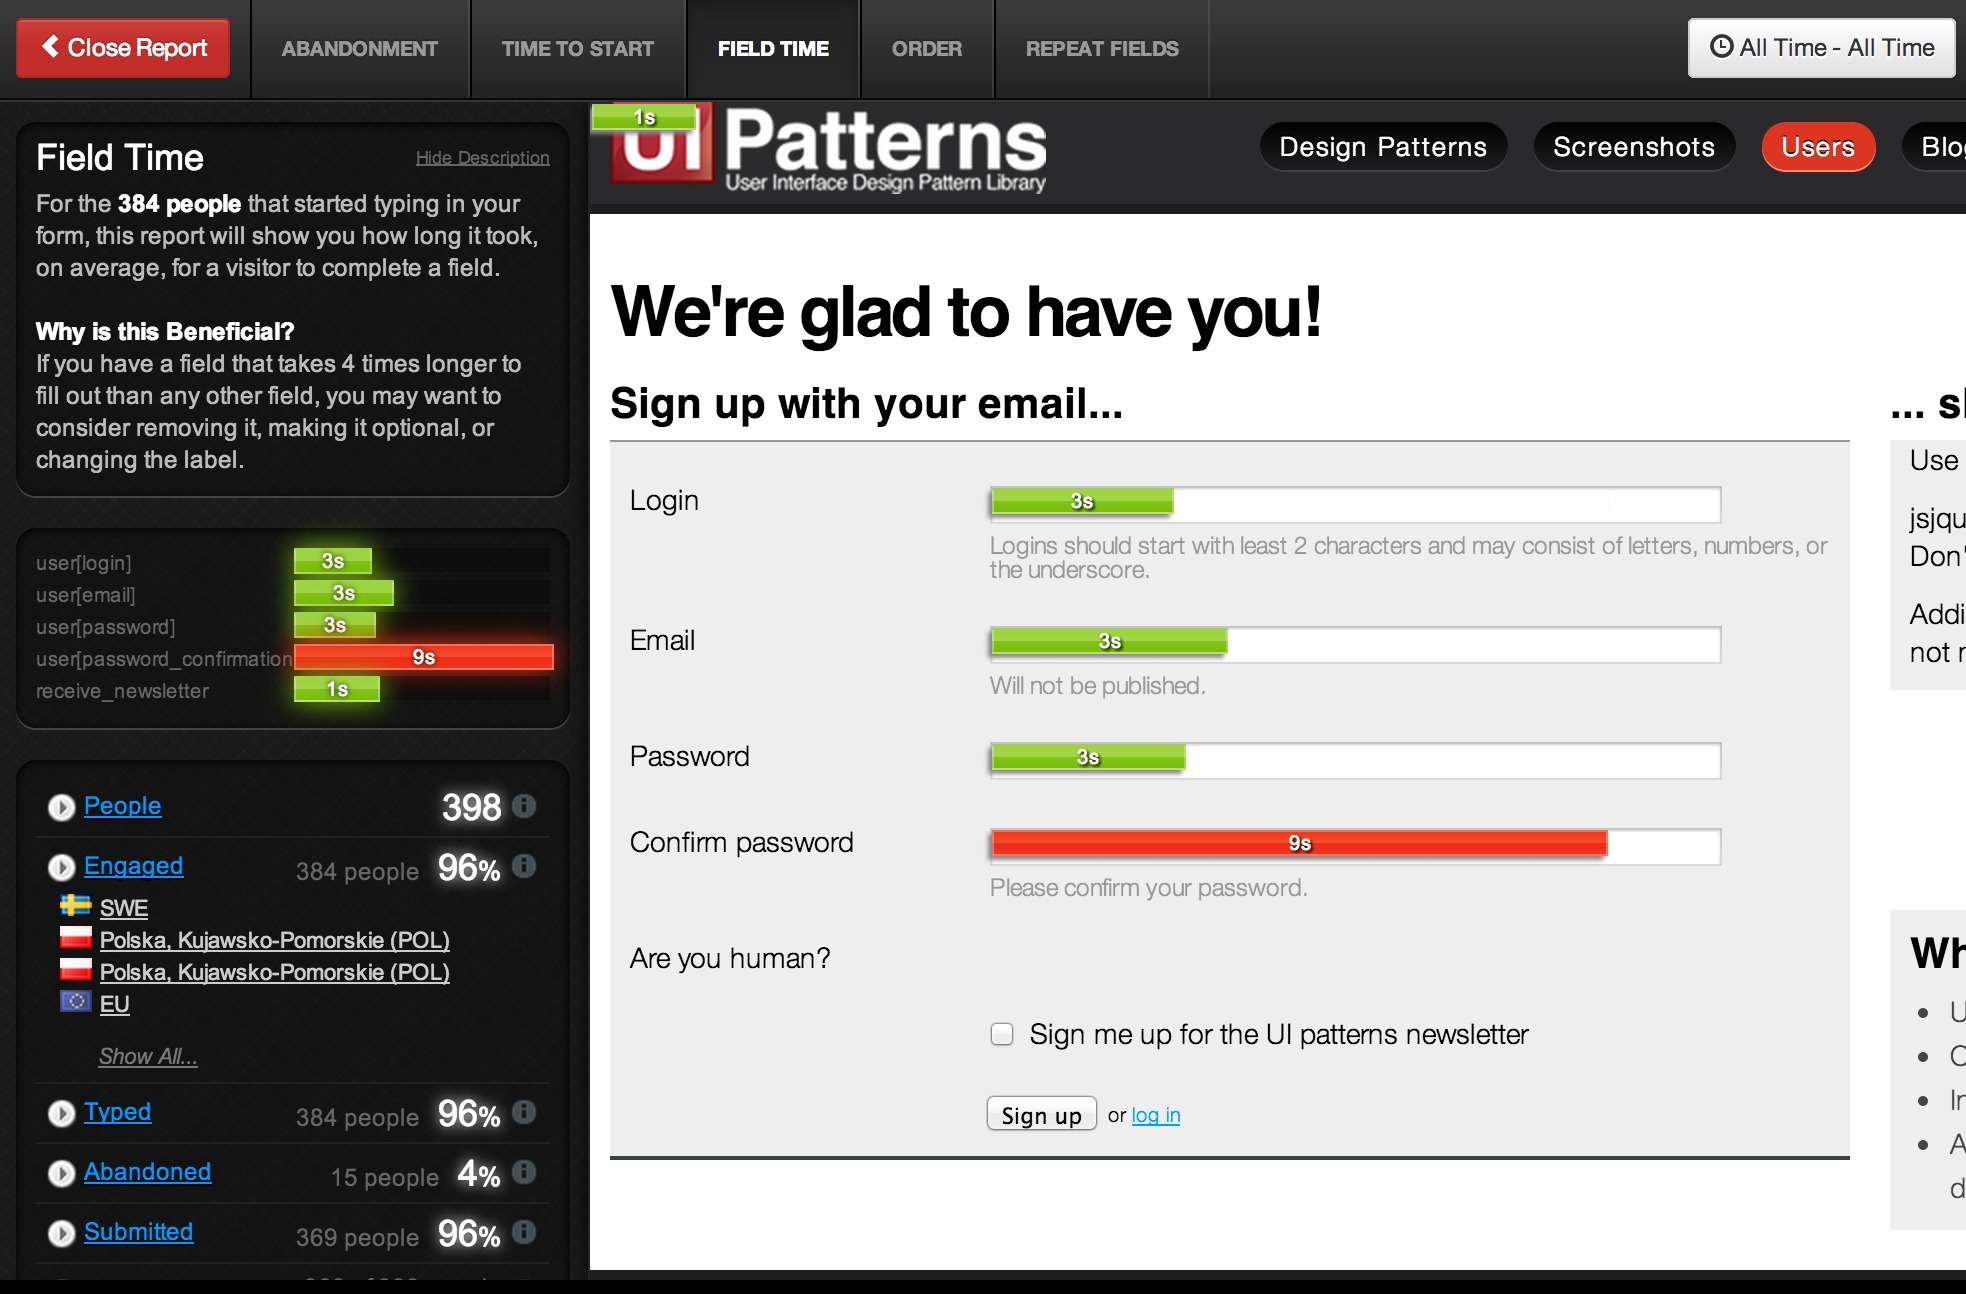
Form and conversion funnel analytics at Lucky Orange.

Form and conversion funnel analytics at Lucky Orange.

HotJar

HotJar is new on the scene and currently in beta mode. They are advertising heavily for people to sign up for their beta and is gaining momentum all around. As the only heatmap service, HotJar will feature a flat $29 plan with unlimited access. If that holds true, HotJar is going to beat its report-based competitors on price and be the cheapest.

The full-fledged feature suite is parted into two: analysis and feedback. The analysis part includes heat maps, session recording and playback, conversion funnel, and form analysis (not launched at the time of writing). The feedback part includes polls, surveys, and recruitment of user testers

HotJar is report-based and operates with a snapshot concept similar to Crazy Egg and Lucky Orange. Compared to the rest of the field, this is HotJar’s biggest drawback and renders it less useless than the top tiers. To get a heat map, you create a heatmap report, that then collects data from 2000 pageviews. Once recorded, the heatmap is done and archived. That allows for comparison between heat maps snap shots over time.

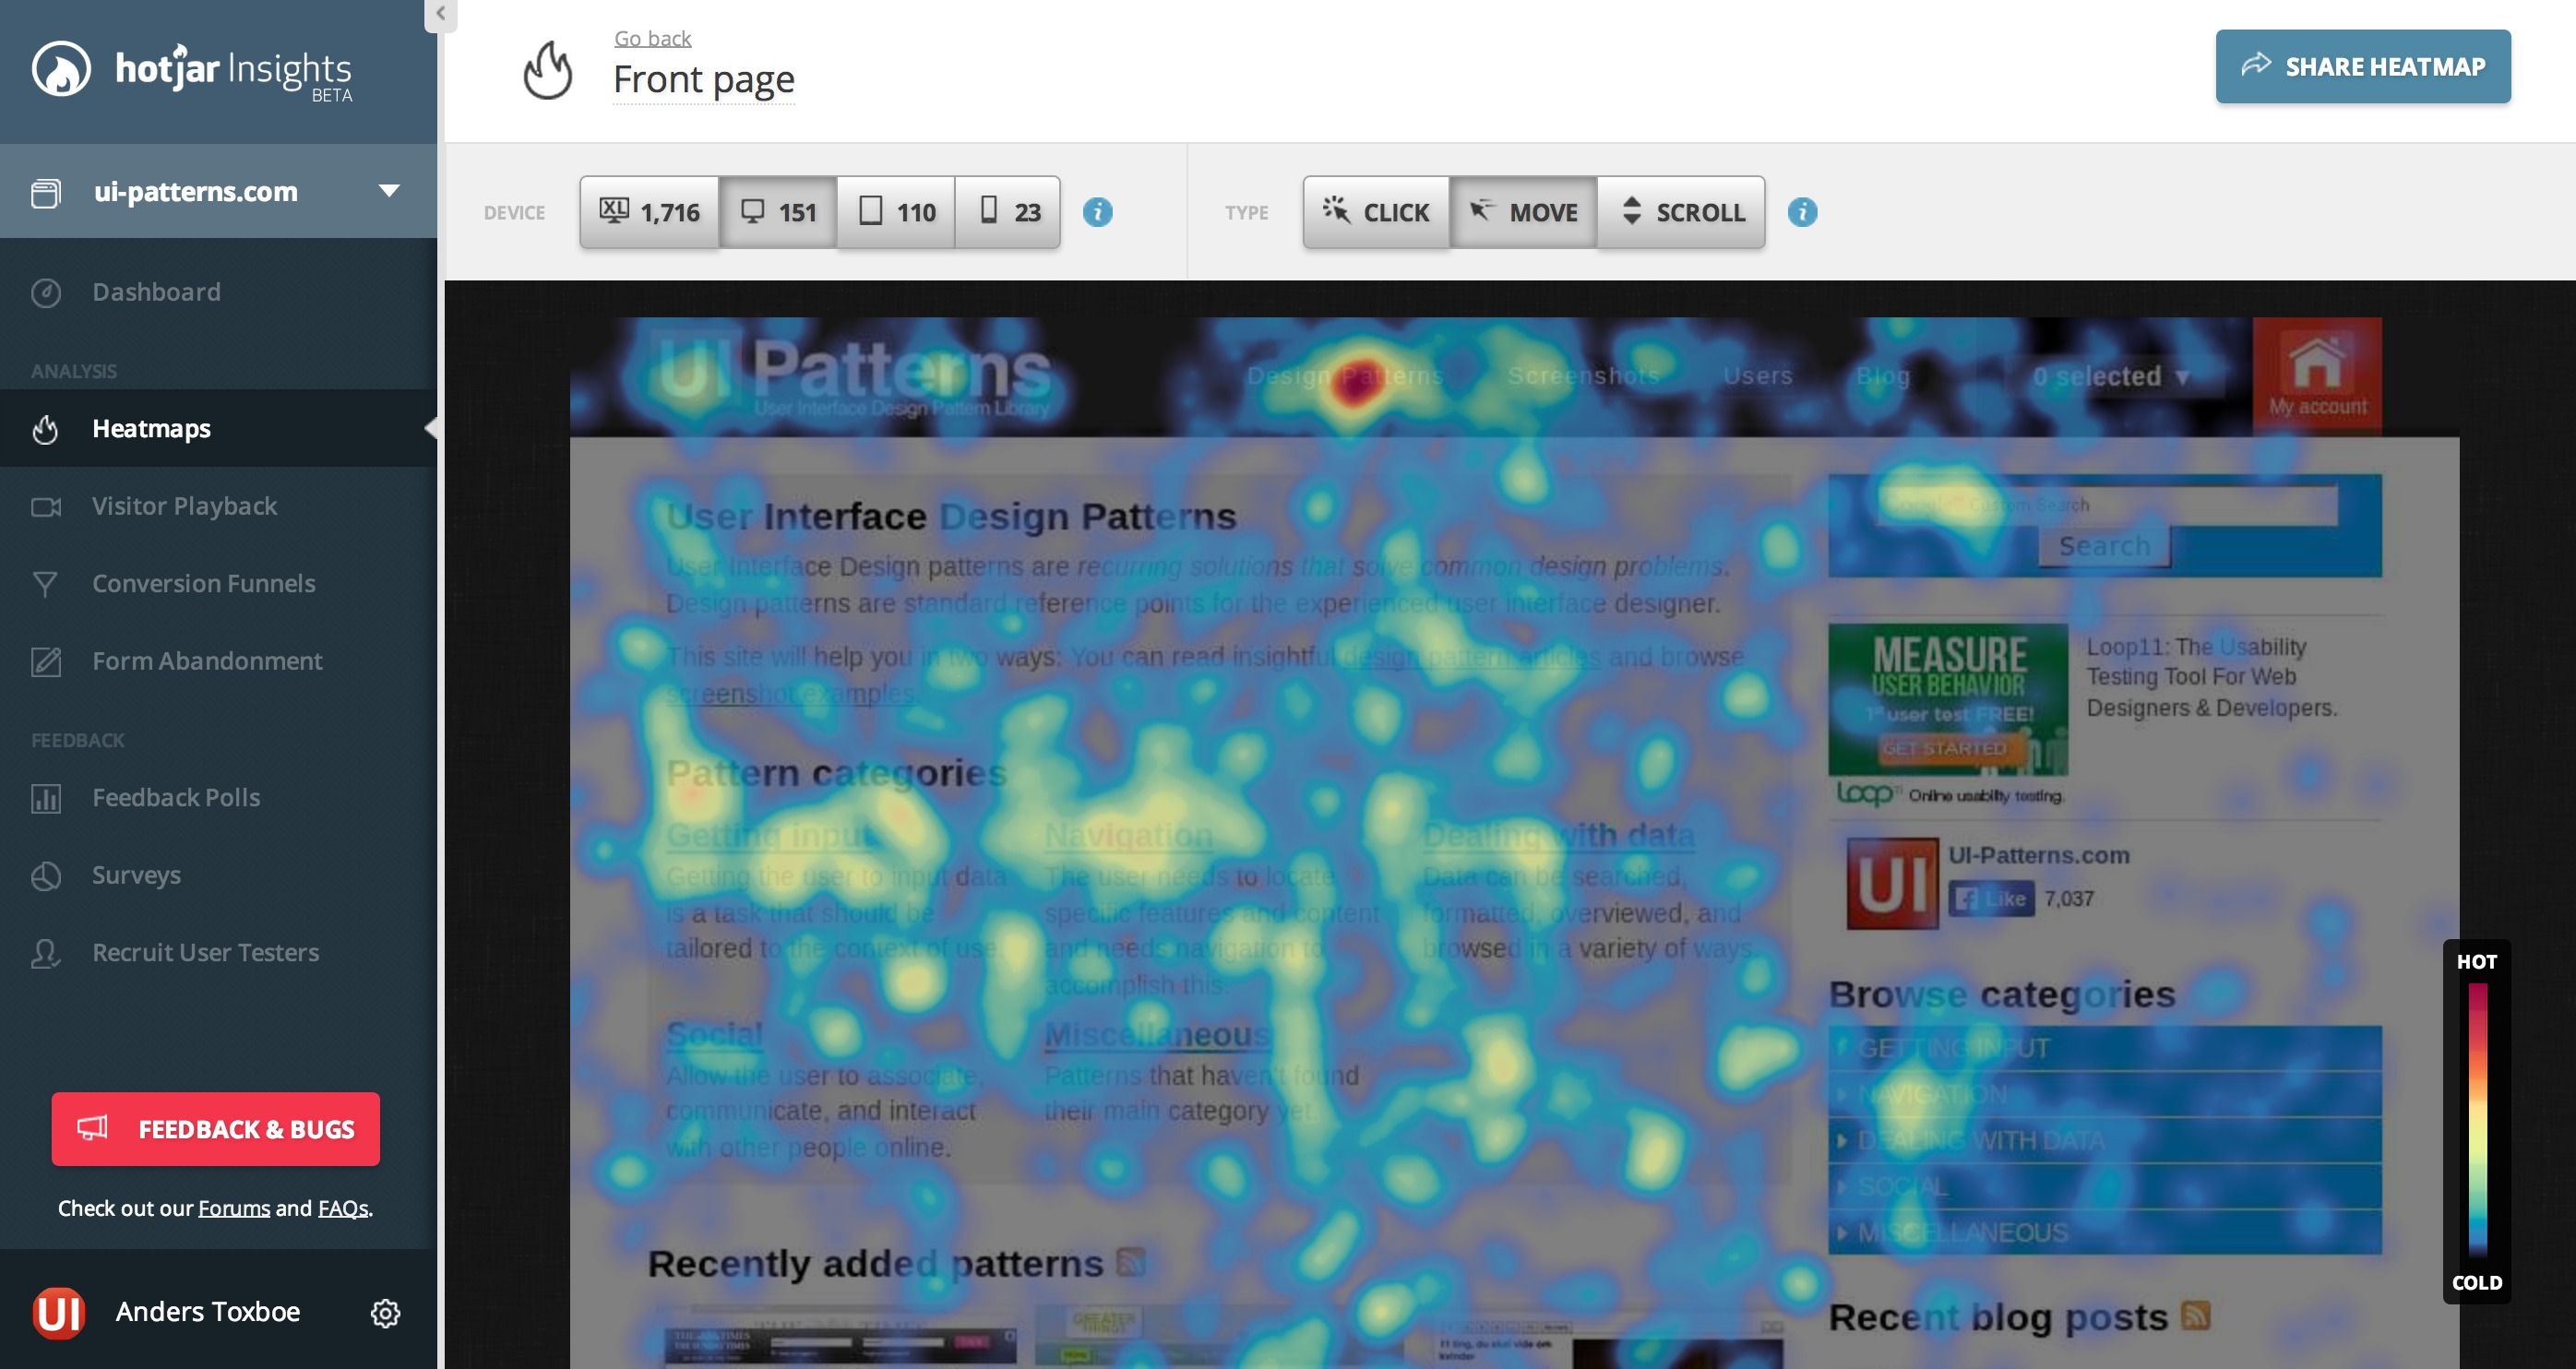
Heat maps at HotJar are generated for 4 different screen sizes. For mobile and tablet, click and mouse move maps are replaced by a tap-heat map.

Heat maps at HotJar are generated for 4 different screen sizes. For mobile and tablet, click and mouse move maps are replaced by a tap-heat map.

HotJar is fresh out of the box and even though it is still in beta mode, attention have been paid to usability and user experience. The interface is clear and uncluttered.

The feedback section of HotJar is well executed. You can setup and target user polls and surveys for specific URLs (on a receipt page, perhaps?) and set the prompts to only appear after a delay, on abandonment, or when the user has scrolled halfway down the page.

Features Usefulness User experience Maturity Price Overall
HotJar 3 3 4 3 5 3.6

MouseStats

MouseStats is multiple times cheaper than its report-based competitors, which is its main upside. The feature list is long and you can do most of what its competitors offer. The area statistics feature that lets you compare the performance of two separate areas (i.e. an enclosed area of pixels) on your site in terms of clicks, and attention.

The downside is poor execution in the details. Examples are the scroll heatmaps that do not show percentages and form analytics that aren’t shown visually on top of form fields.

Features Usefulness User experience Maturity Price Overall
MouseStats 3 3 3 2 5 3.2

Pricing

Depending on how much traffic you have, different price points will match your site. I have compared prices in three price-points – $20-$30, $50-$75, and $100-$150. Each service have been ordered by the cost per thousand visitor (Cost Per Mille – CPM).


Pricepoint: $20-$30 Visitors Exact price CPM
CrazyEgg Report based 25,000 $19 $0.76
Lucky Orange Report based 25.000 $20 $0.80
Mousestats Report based 15,000 $20 $1.33
HotJar Report based 15,000 $29 $1.93
Inspectlet Always on 5,000 $39 $7.80
Mouseflow Always on 1,000 $19 $19.00
Navilytics Always on 500 $20 $40.00
Seevolution Always on 300 $29 $96.67
ClickTale Always on N/A N/A N/A

Pricepoint: $50-$75 Visitors Exact price CPM
CrazyEgg Report based 100,000 $49 $0.49
HotJar Report based 50,000 $29 $0.58
Lucky Orange Report based 62500 $50 $0.80
Mousestats Report based 50,000 $50 $1.00
Seevolution Always on 30,000 $79 $2.63
Inspectlet Always on 25,000 $79 $3.16
Mouseflow Always on 10,000 $74 $7.40
Navilytics Always on 2,500 $80 $32.00
ClickTale Always on N/A N/A N/A

Pricepoint: $100-$150 Visitors Exact price CPM
HotJar Report based 100,000 $29 $0.29
Lucky Orange Report based 250,000 $100 $0.40
CrazyEgg Report based 250,000 $99 $0.40
Mousestats Report based 100,000 $90 $0.90
Seevolution Always on 100,000 $149 $1.49
Inspectlet Always on 50,000 $149 $2.98
Mouseflow Always on 25,000 $148 $5.92
Navilytics Always on 5,000 $130 $26.00
ClickTale Always on N/A N/A N/A

Disclaimer: The limits set on the HotJar service is artificial – they will (once they launch) provide a one-fee service with unlimited recordings. Secondly: If a service charges per pageview and not per visitor, 4 pageviews per visitor is assumed.

Report based: If you only look at price, Crazy Egg looks like the undisputed winner of the report based services, with HotJar coming up right behind them with their fixed $29 unlimited plan and Lucky Orange also being a great contenter. Crazy Egg lacks user recording playback and several other major features, where HotJar excells.

Always on: SeeVolution is the price winner of the always on services, but as with Crazy Egg, lacks playing back user recordings. That leaves Inspectlet as having the best price.

The verdict

Comparing all services, one stand out as being more professional and more mature: ClickTale. If you have got the money and are more than serious about your analytics needs, they seem like the obvious choice.

Lining up the score, the winners are:

Verdict: Report based heatmap services

Even though Lucky Orange is the most smooth, mature and joyful software to use of the report services its price weighs it down. This puts HotJar in front of the report based category, even though its still in beta. Lucky Orange is a strong contender as well since they updated their pricing strategy in March 2015 (prices have been updated in this review). If you are all out of money, go for MouseStats. The report-based approach is not recommended.

Features Usefulness User experience Maturity Price Overall
HotJar 3 3 4 3 5 3.6
Lucky Orange 3 3 4 4 4 3.6
MouseStats 3 3 3 2 5 3.2
Crazy Egg 2 2 2 4 3 2.6

Verdict: Always on heatmap services

The winner of the always on category is Mouseflow. Always-on services is recommended.

Features Usefulness User experience Maturity Price Overall
Mouseflow 4 5 4 4 3 4.0
ClickTale 5 5 3 5 1 3.8
Inspectlet 3 4 4 3 4 3.6
SeeVolution 3 3 3 2 3 2.8
Navilytics 3 3 2 2 2 2.4
Anders Toxboe Author

Based out of Copenhagen, Denmark, Anders Toxboe is a Product Discovery coach and trainer, helping both small and big clients get their product right. He also founded UI-Patterns.com and a series of other projects. Follow Anders at @uipatternscom.