3 of 13 diagrams examples collected by malmond
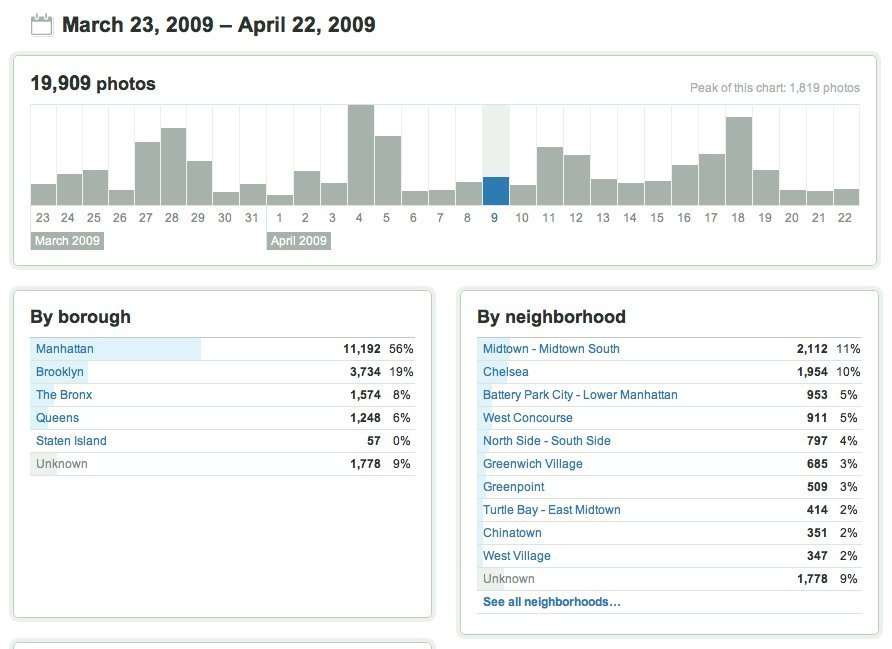
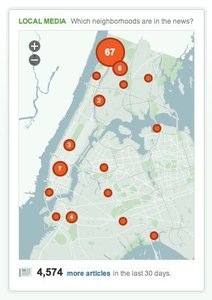
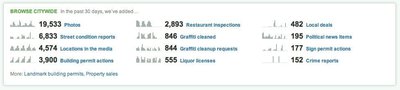
diagrams at Nyc at Everyblock
- nyc.everyblock.com (source)
- Browsing diagrams collection by malmond
- Categorized under graph percentages table list
- Added to collection by malmond
- First added to the 14 examples of data visualization on the web collection
- Added on 2009-04-23
More diagrams screenshots
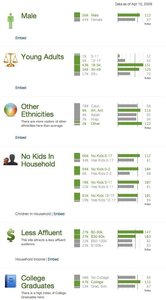
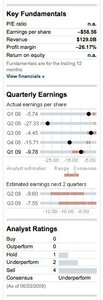
From quantcast.com
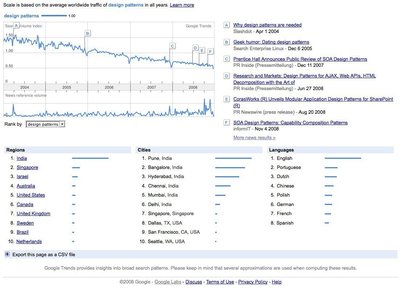
From trends.google.com
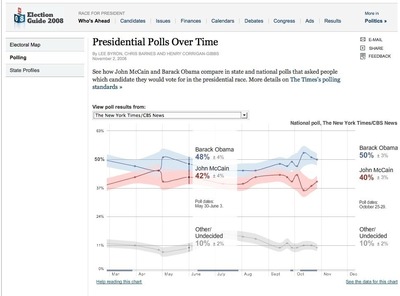
From topics.nytimes.com
From wikirank.com
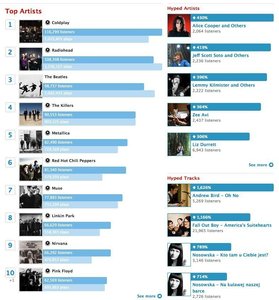
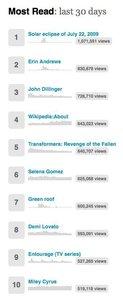
From last.fm
From wikirank.com
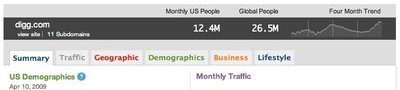
From quantcast.com